Do you know your customer? How often they visit your website or buy a product or service? Do you analyze the data of all transactions? A Customer Analytics job!
Customer Analytics is a broad field. You’ll analyze structured and semi structured data. You’re going to use the insights on a regular basis within BI reports or fully automated to deliver user-specific content on your website.
Let’s start with an easy example – clustering customers/products based on transaction data (=data from booking/payment systems). Thanks to DataCamp for their great Course on Customer Segmentation!
RFM segmentation based on Book Store Transaction Data
The public data source for this example is available on kaggle.com. We’ll perform an RFM segmentation, which is basically a highly aggregated KPI/scoring System for the recency, frequency and the monetary value of your customer.
The Dataset
The dataset includes 1.067.371 transactions of an online book store. That data contains 2009 (= 45228 rows) and 2010 (= 1022143 rows). We will focus on 2010 data – you can analyze 45k rows within excel…
import pandas as pd
from datetime import datetime, timedelta

data_file = './data/online_retail_II.csv'

def load_data(file, sep=','):
    data = pd.read_csv(file, sep=sep)
    return data

data = load_data(data_file)
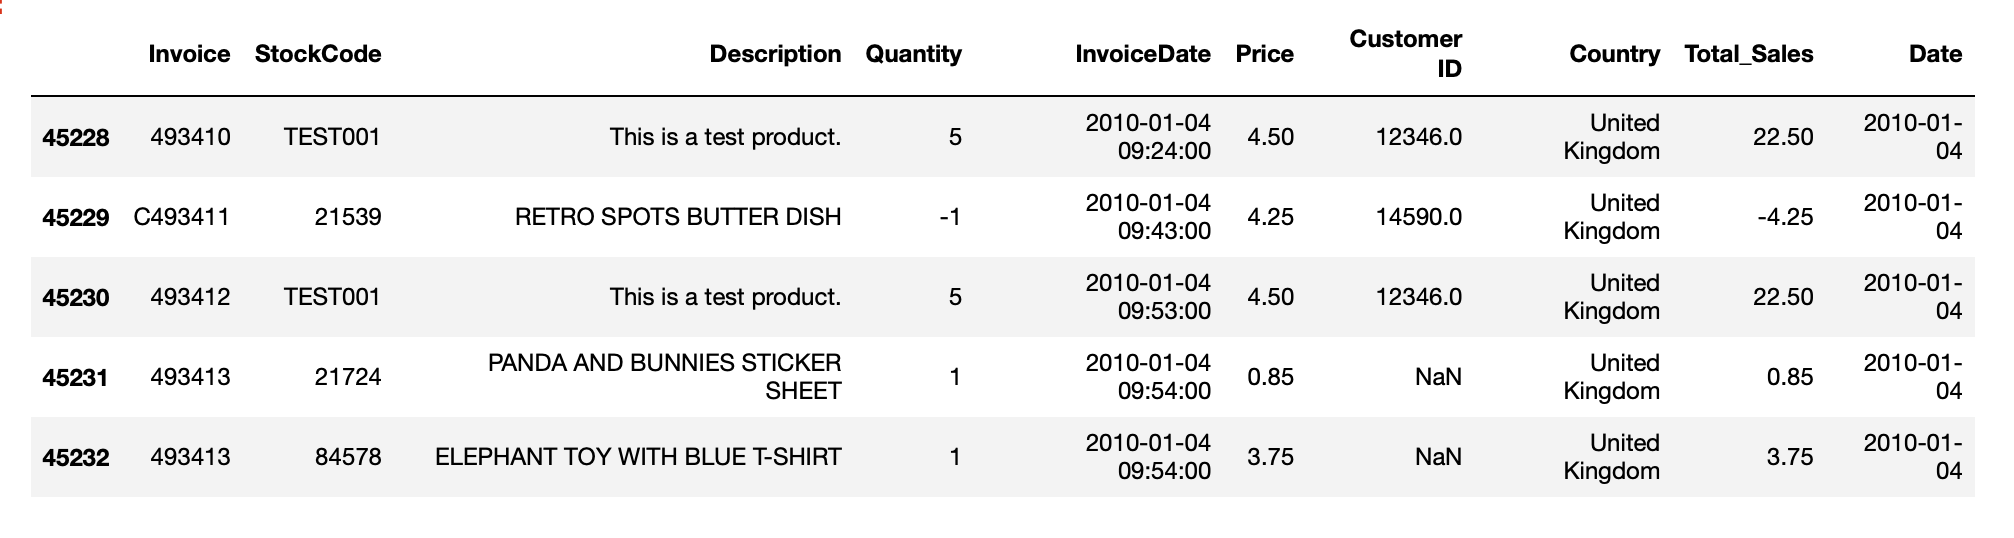
We want to showcase how easy and efficient you can aggregate raw data to customer cluster. We’ll skip most the data quality and preparation task (there are a few NaN, neg. transactions, products with negativ prices and other typical issues)
# getting an overview of the data
data.info()
data.describe()
Before we start with the clustering:
- we need a total sum aka total sales by multiply quantity and price
- we don’t need the full timestamp and convert it to a date (YYYY-MM-DD)
data['Total_Sales'] = data['Quantity'] * data['Price']
data['Date'] = pd.to_datetime(data['InvoiceDate']).dt.date

# only data of 2010
data = data[pd.to_datetime(data.Date).dt.year >= 2010]
Clustering Data
Now we can perform our RFM segmentation. Therefore we’ll define our today and group the data by recency, frequency and the monetary value. In our case, it’s easy, we use the difference of the last transaction and today as date, count the invoices and sum up the total sales of a customer.
today = max(data.Date) + timedelta(days=1)
rfm = data.groupby(['Customer ID']).agg({
    'Date': lambda x: (today - x.max()).days,
    'Invoice':'count',
    'Total_Sales':'sum'
})

rfm.rename(columns = {
    'Date':'Recency',
    'Invoice':'Frequency',
    'Total_Sales':'MonetaryValue'
}, inplace = True)
That will generate the three KPIs per CustomerID. In the next step we’ll cluster the absolut values of each customer to a range of let’s say four clusters.
r_labels = range(4, 0, -1); f_labels = range(1,5); m_labels = range(1,5)

r_quartiles = pd.qcut(rfm['Recency'], 4, labels = r_labels)
f_quartiles = pd.qcut(rfm['Frequency'], 4, labels = f_labels)
m_quartiles = pd.qcut(rfm['MonetaryValue'], 4, labels = m_labels)

rfm = rfm.assign(R = r_quartiles.values)
rfm = rfm.assign(F = f_quartiles.values)
rfm = rfm.assign(M = m_quartiles.values)
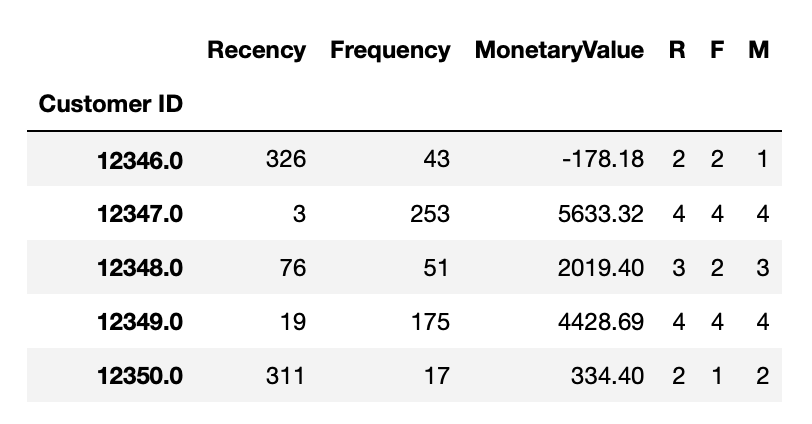
Now we know that customer 12347, who bought a product a few days ago, is frequently buying and spending relative high amount of money. Can we build groups of customers with this information? Yes, we can build a RFM segment and sum up the three KPIs to an overall RFM score.
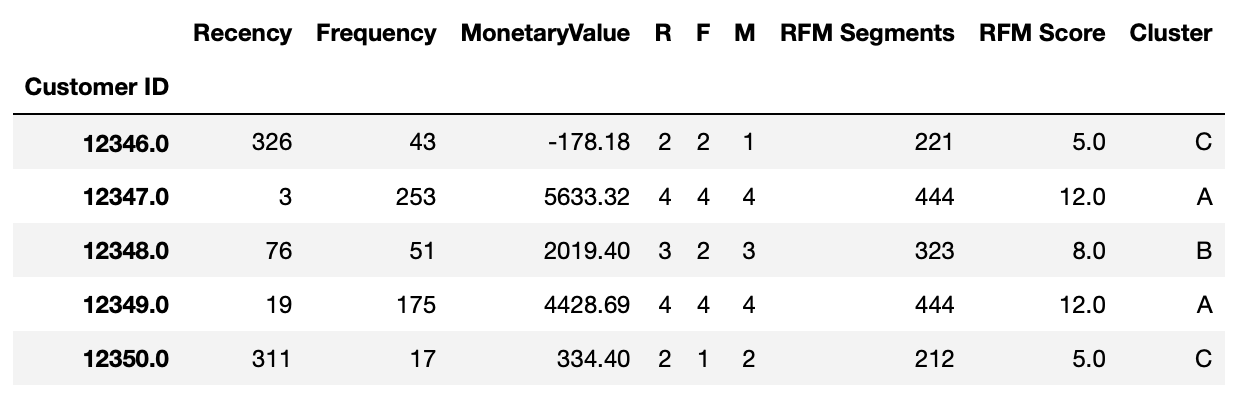
def join_rfm(x): return str(x['R']) + str(x['F']) + str(x['M'])

rfm['RFM Segments'] = rfm.apply(join_rfm, axis=1)
rfm['RFM Score'] = rfm[['R', 'F', 'M']].sum(axis=1)
To analyze how often a customer segment is buying and what amount of money they’ll spend in average. We’ll calculate the averages by the RFM scores and count how many customers are in that segment.
rfm.groupby('RFM Score').agg({
    'Recency':'mean',
    'Frequency':'mean',
    'MonetaryValue':['mean', 'count']
}).round(1)
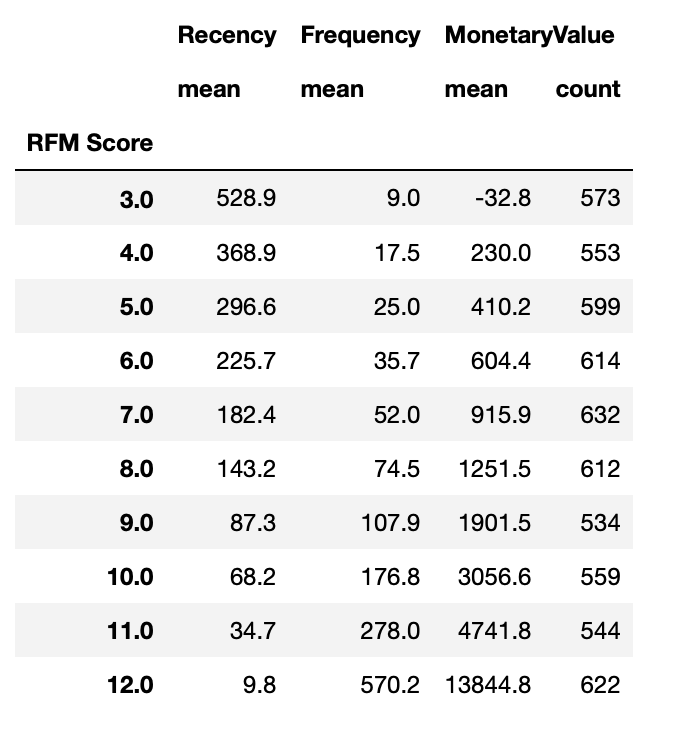
Great, now we know that our most profitable customer segment will place an order 3.5 times more often than the next segment. In average they place orders for nearly 2.5 times the money!
We can’t plan and rollout specific marketing campaigns for 12 customer segments. What about a classic A, B, C cluster? Okay!
def segment_three(df):
    if df['RFM Score'] >= 10:
        return 'A'
    elif (df['RFM Score'] >= 6) and (df['RFM Score'] < 10):
        return 'B'
    else:
        return 'C'

rfm['Cluster'] = rfm.apply(segment_three, axis=1)
rfm.groupby('Cluster').agg({
    'Recency':'mean',
    'Frequency':'mean',
    'MonetaryValue':['mean', 'count']
}).round(1)
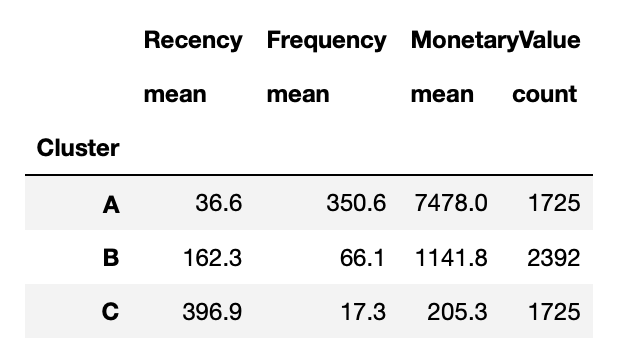
That’s a valuable insight, right?
Wrap up
We analyzed around 1 million rows of customer orders by:
- calculating their recency, frequency and monetary value
- aggregating information and build RFM segments – we can use this segmentation to identify segments that e.g. spend much money but not that frequently or analyze which segment is more valuable for our business (frequently buyer or buying more expensive products)
- summing up to a A, B, C cluster and can now decide on further marketing actions
Read more – Part 2: Customer Analytics with Python Part 2 – data preparation for k-means clustering
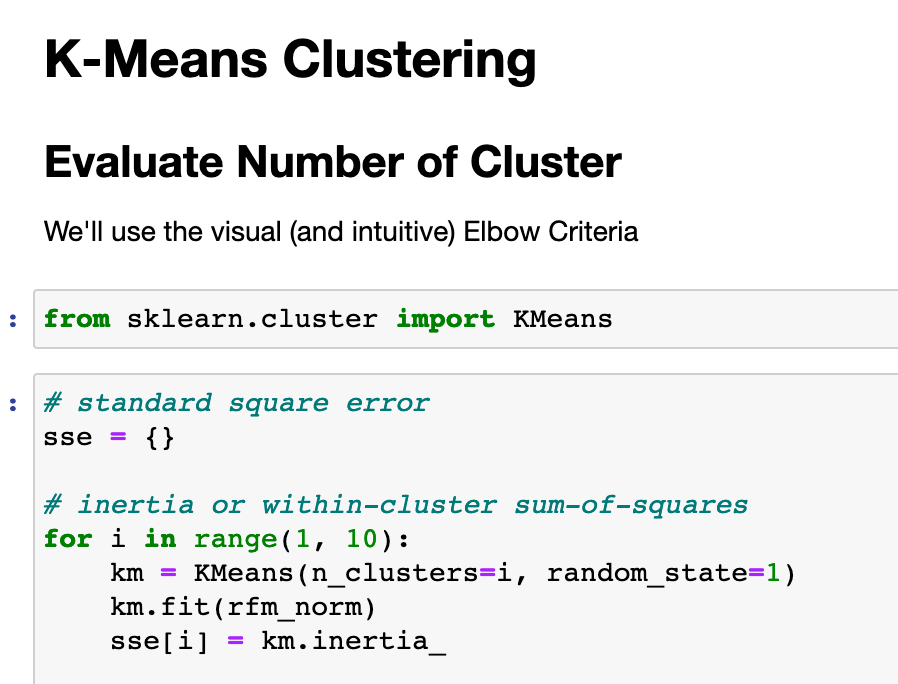
Read more – Part 3: Customer Analytics with Python – KMeans Clustering